By: Joseph Wooster, Senior Data Scientist
As COVID-19 continues to spread, epidemiological models have been widely accepted in attempts to predict when the number of cases will “peak” at State and National levels. Numerous factors can impact the accuracy of these models including the amount of time passed, frequency of travel, transmissibility of the disease, and the impact of control strategies such as social distancing.
At Proactive MD we promise to always fight for the greatest good of our patients. Making this promise means we look for ways that data can help us prepare to provide care that is necessary for our patients, both now and in the future. It’s not enough for us to analyze the data we are receiving – we want to solve problems before they happen. We realized that in order to serve our patients we needed to understand how COVID-19 was going to impact communities – not just states or the country.
So our team moved to develop our own forecasting tools to project future spread in the areas we serve.
Here’s some background on our forecasting tool (which you can access by clicking the link above): There are three terms we’d like to clarify as we dig into the data behind COVID-19. First, we’d like to explain what we mean by “projections.” Projections are made by taking the current available data and finding the line that best fits the data. This line can be drawn out to make future projections based solely on currently available data. Closely related is the term “forecasting.” Forecasting takes the core idea of projections, using currently available data, and adds parameters that are valid assuming the future remains stable. “Predictions” rely on making hypotheses about future conditions’ impacts on the data. Projections and forecasts can be useful in three ways: 1) monitoring a situation, 2) planning a response to a situation and 3) evaluating control strategies. To put this another way, a projection looks simply at the available data; a forecast looks at the available data and what factors influenced that data; finally, a prediction looks at the available data and makes hypotheses regarding how future changes may impact the data.
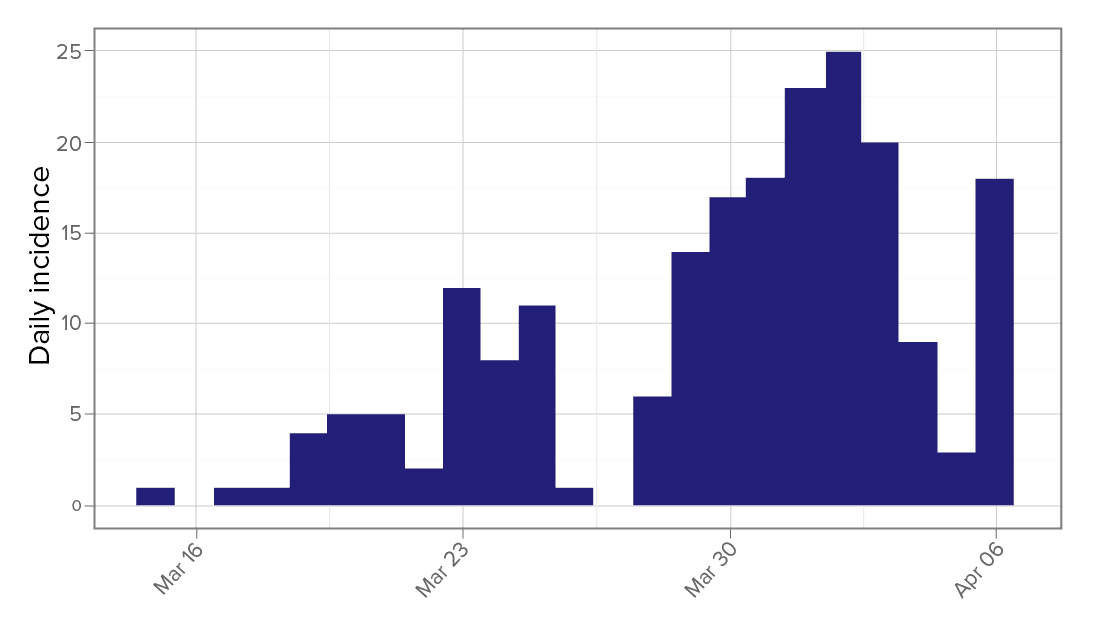
The first step to any of these concepts is understanding what has already happened in the data. In epidemiology, this is frequently accomplished through incidence plots. Incidence plots, as the name would imply, are looking at the number of new cases for a given period. In this case we will be looking at the number of new cases confirmed daily[1]. This is an example of an incidence plot for a county in the Southeastern United States.
Before we begin forecasting any future cases, we must understand how infectious the disease is as well as how quickly the disease spreads. The basic reproduction rate (R0) is used to describe, on average, how many people one person with the disease can infect. In other words, if Patient A has the disease and infects Patients B, C, and D, R0would be 3. Early studies estimated R0 for COVID-19 was around 2.2-2.71. As more data has become available, R0 is now estimated to be around 5.7[2]. The other piece, how quickly the disease spreads, is referred to as the serial interval. The serial interval describes the duration of time between the onset of symptoms in a primary case and the onset of symptoms in a secondary case infected by the primary case. According to data released by the CDC, the average serial interval for COVID-19 is 3.96 days[3]. Understanding the serial interval, we can estimate R0 for populations based on incidence data we provide.
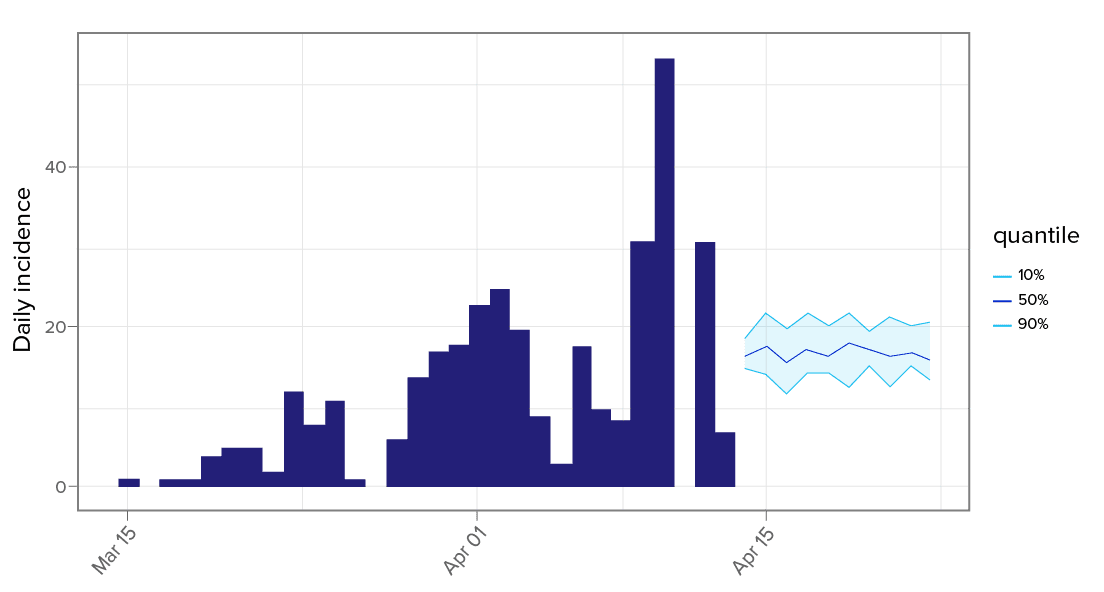
Based on the work of Thibaut Jombart, associate professor in outbreak analytics and member of the UK Public Health Rapid Support Team, our projections were made following a Poisson Distribution. In a single sentence, this means we evaluated “the probability of a given number of events happening in a specified time period”[4]. Using the available incidence data1 and serial interval3, we can estimate several plausible projections for R0. Once these projections for R0 are made, we can run numerous simulations and forecast the number of daily new cases in coming days based on the current data and trends. It is important to note that our modeling assumes R0 remains constant for the period of days being projected. This can be used for short-term forecasting; however, we know there are factors that will impact changes in both the serial interval and basic reproduction rate (R0) as time progresses.
Statistician George Box is famously quoted as saying “all models are wrong, but some are useful.” While we understand the assumptions and limitations of a model like this, there is value for planning and preparing. At national and state levels, public health officials are using models[5] to prepare hospital systems to handle the influx of patients potentially exposed to COVID-19. At Proactive MD we have used these forecasts to prepare clinics for increases in visits and to preemptively shift supplies of PPE and test kits to clinics in need. Our patient advocates are also empowered with data to outreach to patients at high risk during this time, ask questions, and listen to understand our patients’ lives and values. Using the data available, Proactive MD is fighting to meet the needs of our patients, both now and in the future.
━━━━━━━━━━━━━━━
[1] Data Source: CDC, WHO, and local health departments via USAFacts.org. Licensed via Creative Commons.
[2] Sanche S, Lin YT, Xu C, Romero-Severson E, Hengartner N, Ke R. High contagiousness and rapid spread of severe acute respiratory syndrome coronavirus 2. Emerg Infect Dis. 2020 Jul. 04/13/2020. https://doi.org/10.3201/eid2607.200282
[3] Du Z, Xu X, Wu Y, Wang L, Cowling BJ, Ancel Meyers L. Serial interval of COVID-19 among publicly reported confirmed cases. Emerg Infect Dis. 2020 Jun. 04/13/2020. https://doi.org/10.3201/eid2606.200357
[4] Glantz Morton, Kissell Robert. “A Primer on Risk Mathematics.” Multi-Asset Risk Modeling, Academic Press, 2014, 21-61. 04/13/2020. https://doi.org/10.1016/B978-0-12-401690-3.00002-0